Up: Statistical Definitions
Previous: Testing Hypotheses
Contents
Subsections
Kolmogorov - Smirnov Test
The Kolmogorov-Smirnov test () is used to decide if a sample
comes from a population with a specific distribution. The
Kolmogorov-Smirnov (K-S) test is based on the empirical distribution
function (ECDF). Given  ordered data points
 , the ECDF is defined as
where
, the ECDF is defined as
where  is the number of points less than
  and
are ordered from smallest to largest value. This is a step function
that increases by
and
are ordered from smallest to largest value. This is a step function
that increases by  at the value of each ordered data point.
An attractive feature of this test is that the distribution of the K-S
test statistic itself does not depend on the underlying cumulative
distribution function being tested. Another advantage is that it is
an exact test (the chi-square goodness-of-fit test depends on an
adequate sample size for the approximations to be valid). Despite
these advantages, the K-S test has several important limitations:
- It only applies to continuous distributions.
- It tends to be more sensitive near the center of the
distribution than at the tails.
- Perhaps the most serious
limitation is that the distribution must be fully specified. That
is, if location, scale, and shape parameters are estimated
from the data, the critical region of the K-S test is no longer
valid. It typically must be determined by simulation.
Due to limitations 2 and 3 above, many analysts prefer to use the
Anderson-Darling
goodness-of-fit test. However, the Anderson-Darling
test is only available for a few specific distributions.
The test is calculated as:
where  is the theoretical cumulative distribution of the
distribution being tested which must be a continuous distribution
(i.e., no discrete distributions such as the binomial or Poisson),
and it must be fully specified (i.e., the location, scale, and shape
parameters cannot be estimated from the data).
is the theoretical cumulative distribution of the
distribution being tested which must be a continuous distribution
(i.e., no discrete distributions such as the binomial or Poisson),
and it must be fully specified (i.e., the location, scale, and shape
parameters cannot be estimated from the data).
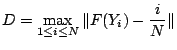
The hypothesis regarding the distributional form is rejected if the
test statistic, D, is greater than the critical value obtained from a
table. There are several variations of these tables in the literature
that use somewhat different scalings for the K-S test statistic and
critical regions. These alternative formulations should be equivalent,
but it is necessary to ensure that the test statistic is calculated in
a way that is consistent with how the critical values were tabulated.
Anderson Darling Test
The Anderson-Darling test (EDF Statistics for Goodness of Fit and
Some Comparisons, Journal of the American Statistical
Association,
69, pp. 730-737.) is used to test if a sample
of data came from a population with a specific distribution. It
is a modification of the Kolmogorov-Smirnov (K-S) test and gives
more weight to the tails than does the K-S test. The K-S test is
distribution free in the sense that the critical values do not depend
on the specific distribution being tested. The Anderson-Darling
test makes use of the specific distribution in calculating critical
values. This has the advantage of allowing a more sensitive test and
the disadvantage that critical values must be calculated for each
distribution. Currently, tables of critical values are available for
the normal, lognormal, exponential, Weibull, extreme value type I,
and logistic distributions.
The Anderson-Darling test is an alternative to the chi-square and
Kolmogorov-Smirnov goodness-of-fit tests.
The test is defined as
The Anderson - Darling test statistic is defined by
where
is the cumulative distribution function of the specified
distribution. Note that the Yi are the ordered data.
The critical values for the Anderson-Darling test are dependent
on the specific distribution that is being tested. Tabulated
values and formulas have been published
for a few specific distributions (normal, lognormal,
exponential, Weibull, logistic, extreme value type 1). The test
is a one-sided test and the hypothesis that the distribution
is of a specific form is rejected if the test statistic, A,
is greater than the critical value.
Note that for a given distribution, the Anderson-Darling statistic may
be multiplied by a constant (which usually depends on the sample size,
n). These constants are given in the various papers by Stephens. In
the sample output below, this is the "adjusted Anderson-Darling"
statistic. This is what should be compared against the critical
values. Also, be aware that different constants (and therefore critical
values) have been published. You just need to be aware of what constant
was used for a given set of critical values (the needed constant is
typically given with the critical values).
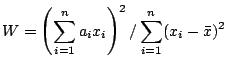
The Shapiro-Wilk test, proposed in (Shapiro, S. S. and Wilk, M. B.
(1965)., Biometrika, 52, pages 591-611.), calculates a  statistic
that tests whether a random sample,
statistic
that tests whether a random sample,
 comes from
(specifically) a normal distribution . Small values of are evidence
of departure from normality and percentage points for the statistic,
obtained via Monte Carlo simulations, were reproduced by Pearson and
Hartley (Biometrica Tables for Statisticians, Vol 2,
Cambridge, England, Cambridge University Press.1972, Table 16). This
test has done very well in comparison
studies with other goodness of fit tests.
comes from
(specifically) a normal distribution . Small values of are evidence
of departure from normality and percentage points for the statistic,
obtained via Monte Carlo simulations, were reproduced by Pearson and
Hartley (Biometrica Tables for Statisticians, Vol 2,
Cambridge, England, Cambridge University Press.1972, Table 16). This
test has done very well in comparison
studies with other goodness of fit tests.
The statistic is calculated as
where the  are the ordered sample values (
 is the smallest)
and the
is the smallest)
and the  are constants generated from the means, variances and
covariances of the order statistics of a sample of size
are constants generated from the means, variances and
covariances of the order statistics of a sample of size  from a
normal distribution
The chi-square test is used to test if a sample of data came from a
population with a specific distribution.
from a
normal distribution
The chi-square test is used to test if a sample of data came from a
population with a specific distribution.
An attractive feature of the chi-square goodness-of-fit test is
that it can be applied to any univariate distribution for which you
can calculate the cumulative distribution function. The chi-square
goodness-of-fit test is applied to binned data (i.e., data put into
classes).
Some disadvantages of the test are
- the value of the chi-square test statistic are dependent
on how the data is binned.
- it requires a sufficient sample size in order for the
chi-square approximation to be valid.
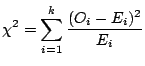
The test is defined for the hypothesis
The statistic is calculated as
where  is the observed frequency for bin
  and
and  is the
expected frequency for bin and is calculated by
where is the cumulative distribution function
and
is the
expected frequency for bin and is calculated by
where is the cumulative distribution function
and  and
and  are the upper and lower limits for class .
The test statistic follows, approximately, a chi-square
distribution with (k - c) degrees of freedom where k is the number
of non-empty cells and c = the number of estimated parameters
for the distribution + 1.
Therefore, the hypothesis that the data are from a population
with the specified distribution is rejected if
where
 is the chi-square percent point
function with k - c degrees of freedom and a significance level of
is the chi-square percent point
function with k - c degrees of freedom and a significance level of
 .
.
Up: Statistical Definitions
Previous: Testing Hypotheses
Contents
2003-08-29

![$\displaystyle S = \sum^{N}_{i=1} \frac{2i-1}{N} \left[ ln F(Y_{i}) + ln(1 -
F(Y_{N+1-i})) \right]
$](img210.png)